
Can the genomic profiles of a sire and dam provide a useful picture of a future calf? We compared the Breeding Analytics projection for J Bar T’s Anna and STR Maverick with the Igenity Beef Profile later received by their son, J Bar T’s DunSmoke.
Breeding decisions must be made before the final result is known. Pedigrees, structure, disposition, performance records, and genomic testing can all help, but the resulting calf still inherits its own combination of genes from the sire and dam.
Breeding Analytics was developed to bring some of that information together. Rather than evaluating a sire or dam independently, the tool estimates the likely direction of a potential offspring for selected traits.
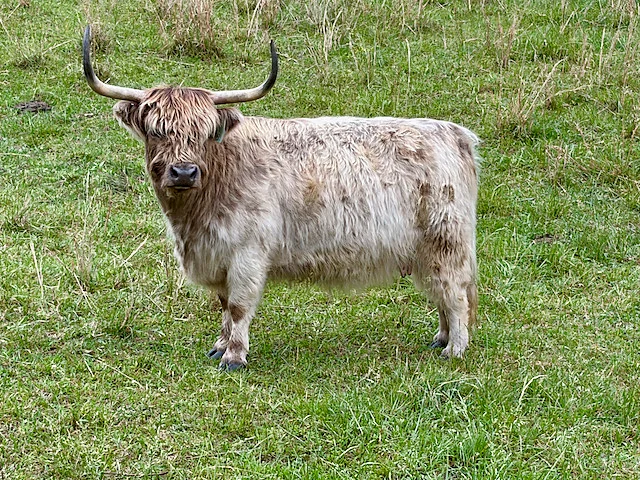
J Bar T’s Anna
Find Anna in the public database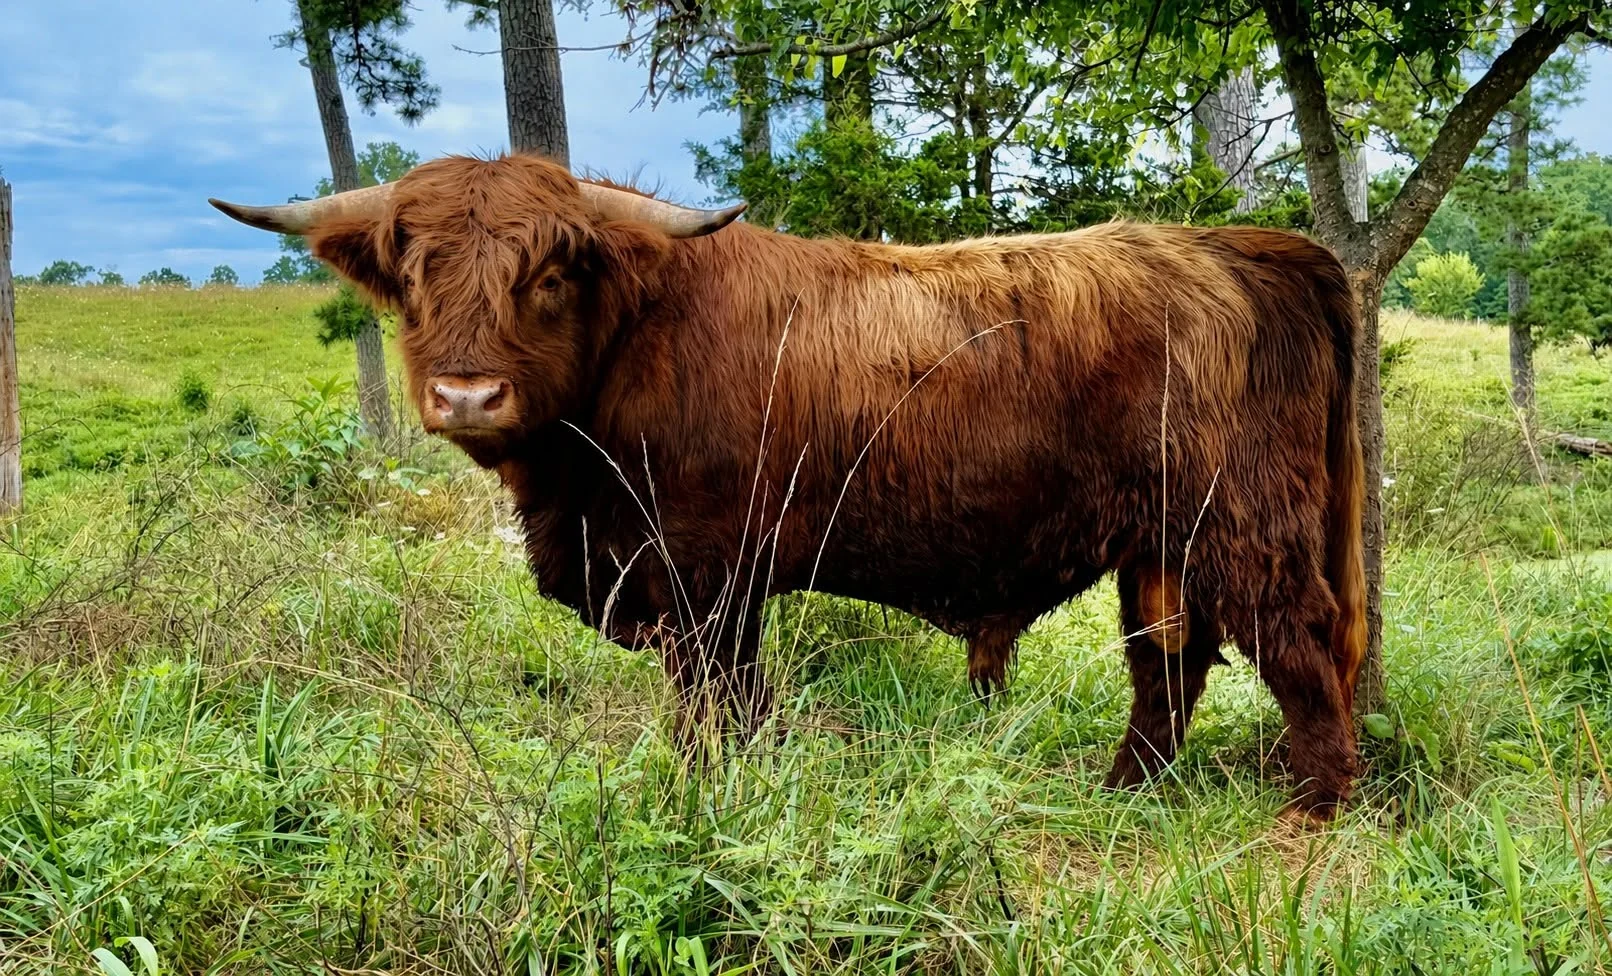
STR Maverick (AI PV D)
View Maverick’s website profile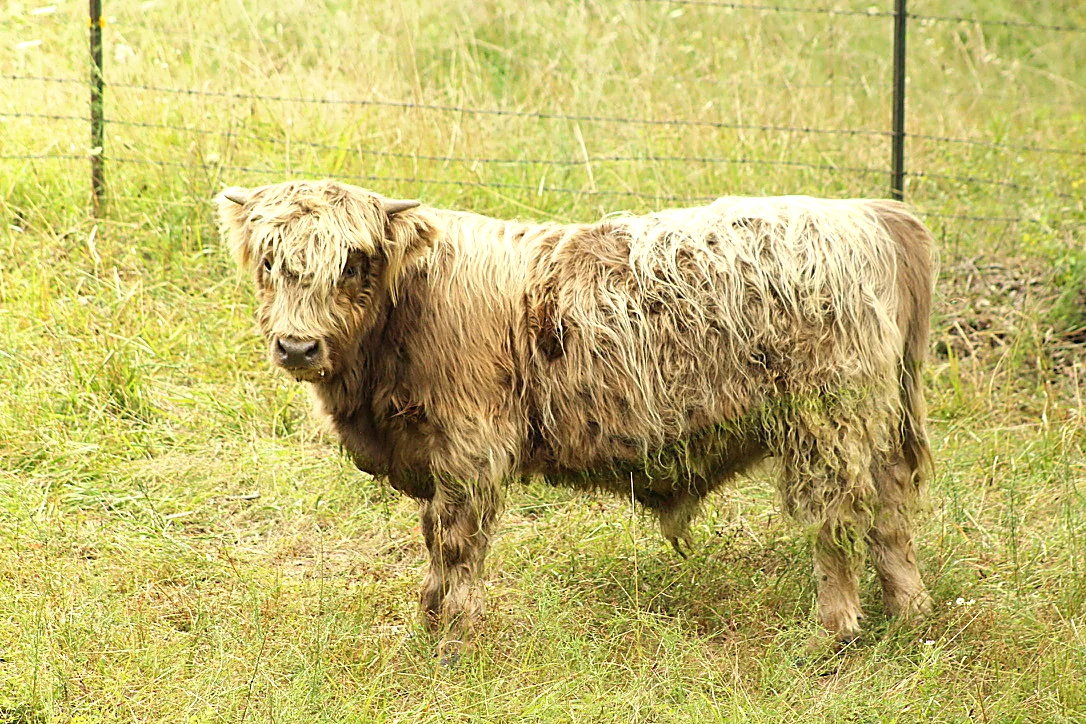
J Bar T’s DunSmoke
Optimized pasture photographThis mating gives us a chance to compare a prediction with a real offspring. Both sides of the comparison use DNA-based Igenity indicators rather than harvested carcass measurements, so the question is whether the parental prediction resembles the genomic profile later observed in their son.
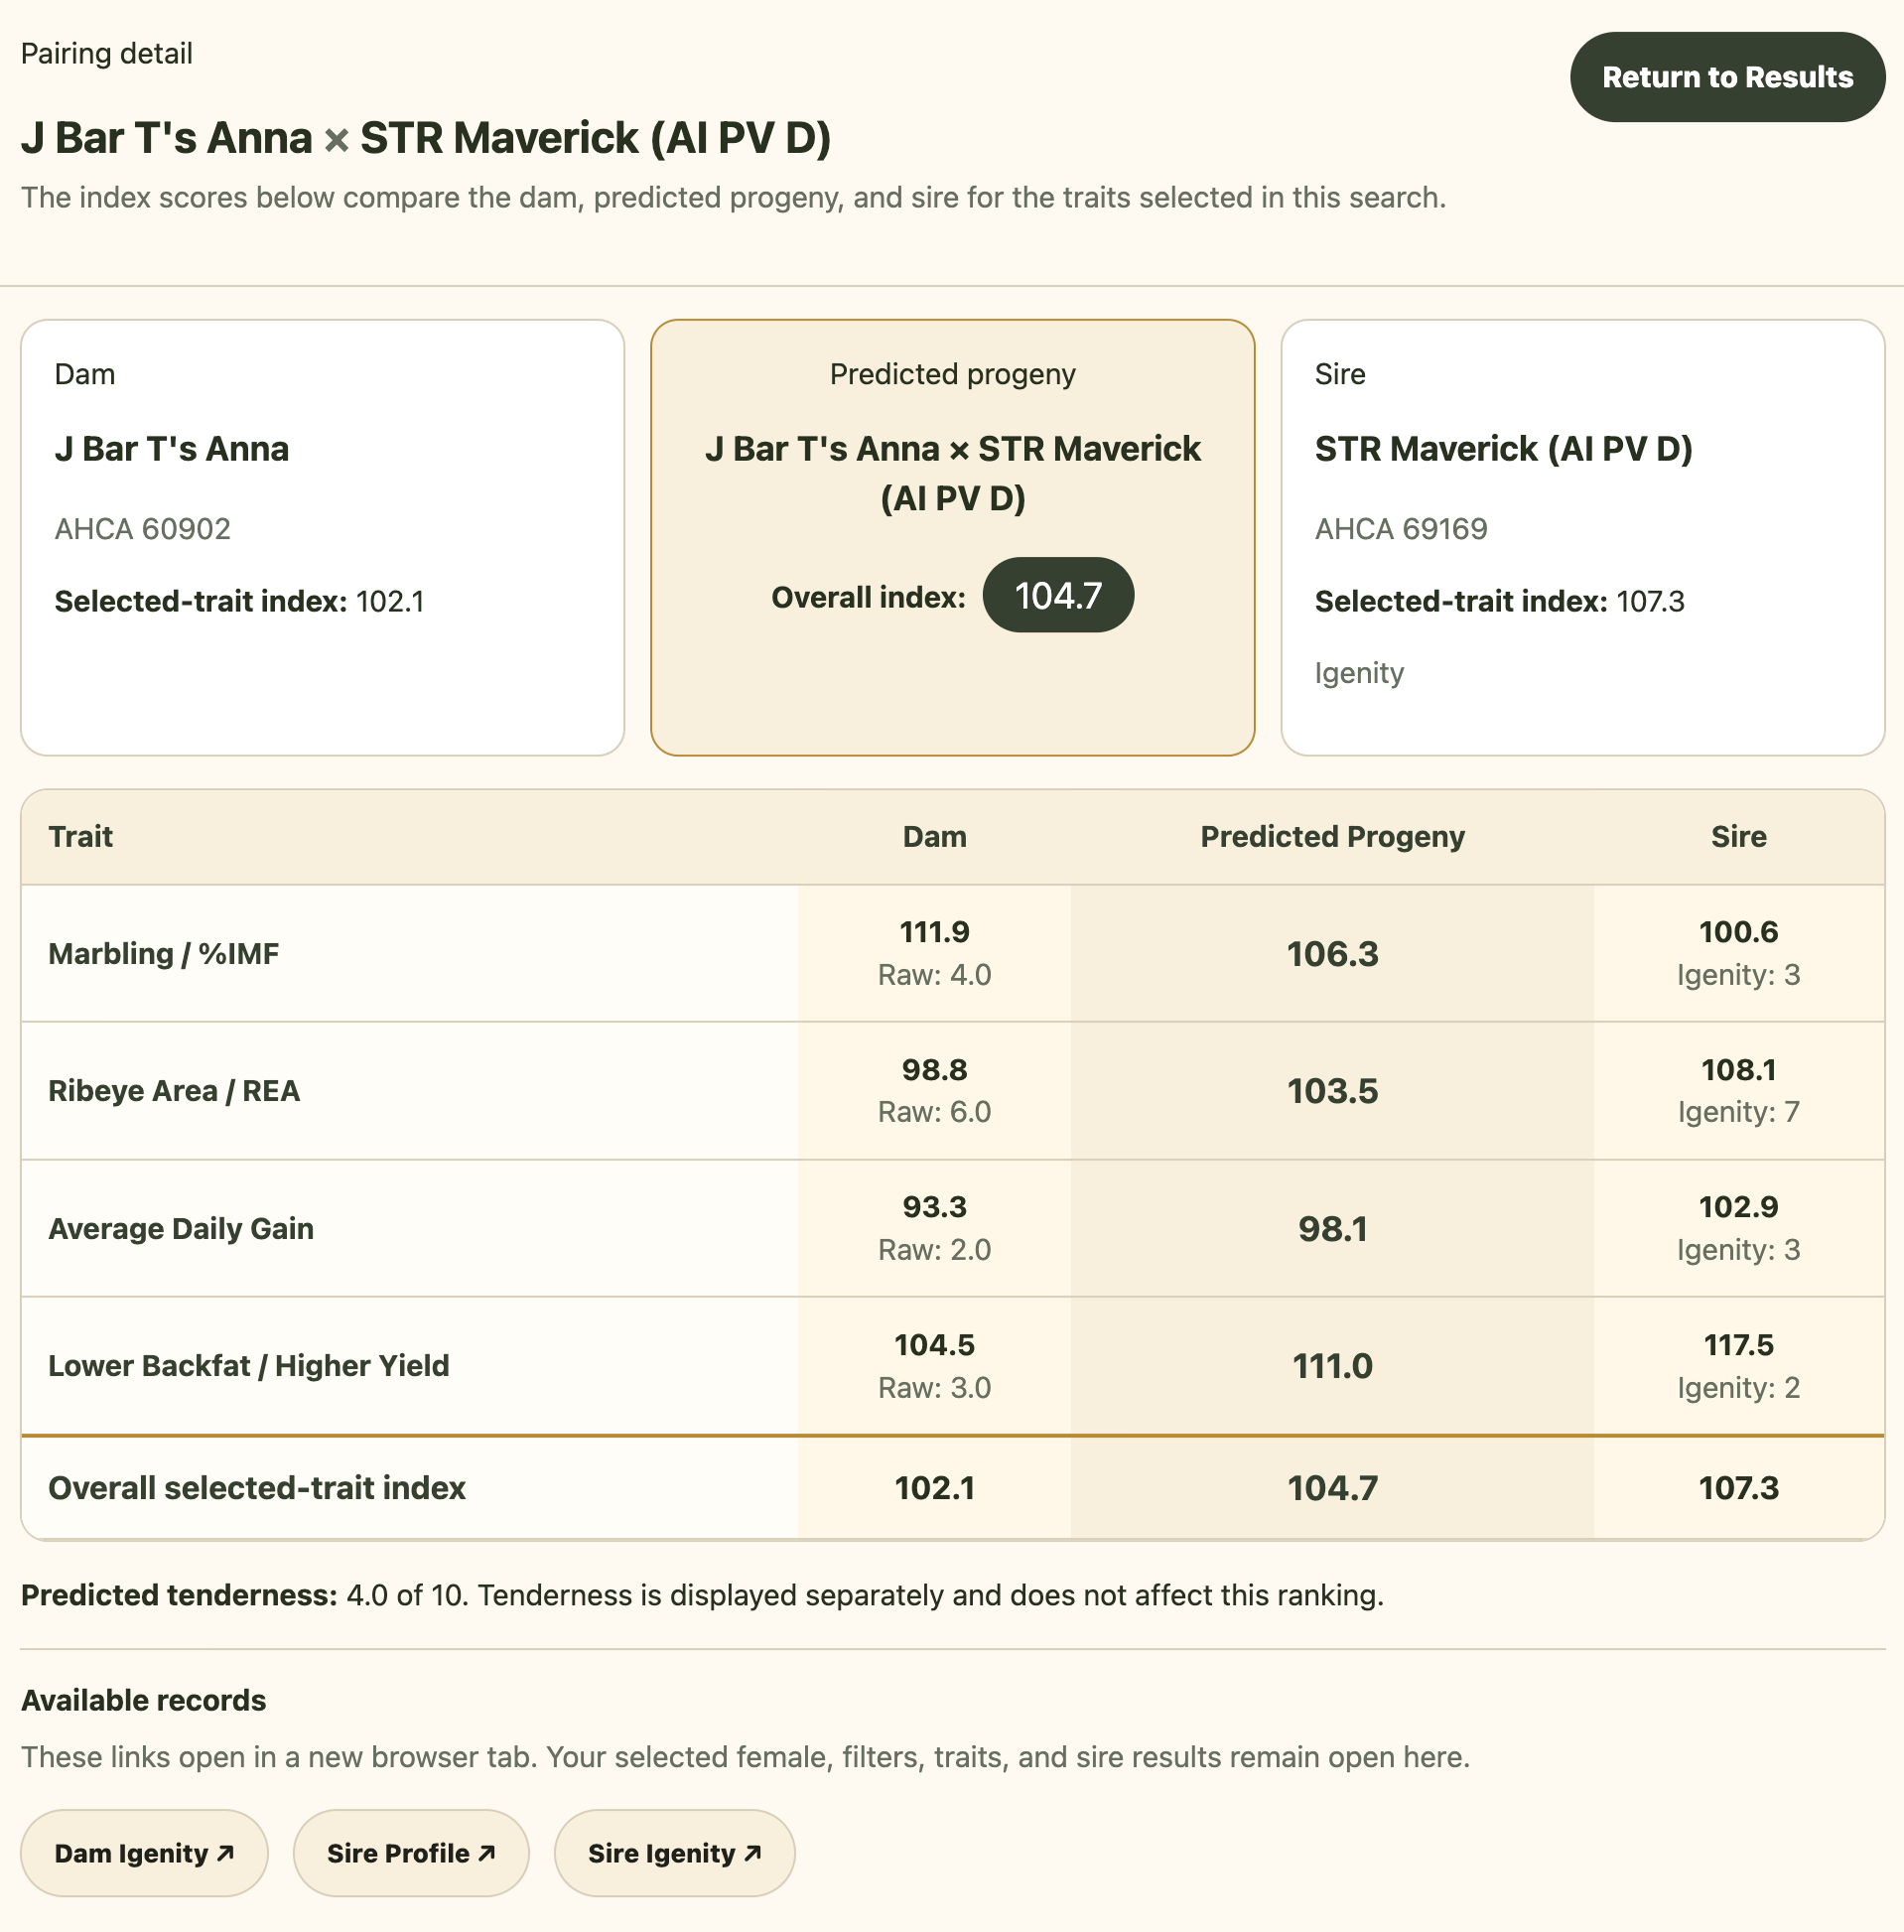
The predicted mating
For this comparison, the selected traits were marbling, ribeye area, average daily gain, and lower backfat or higher expected yield.
The index standardizes the selected traits within the applicable database population so that animals measured on different scales can be compared. An index near 100 is near the comparison average. The predicted value of 104.7 suggested an offspring moderately above that average across the traits chosen for the search.
DunSmoke’s observed Igenity profile
DunSmoke’s own Igenity Beef Profile later produced a balanced carcass picture. His strongest displayed score was ribeye area at 7, followed by tenderness at 6. Hot carcass weight was centered at 5, while marbling was 4 and fat thickness was 3.
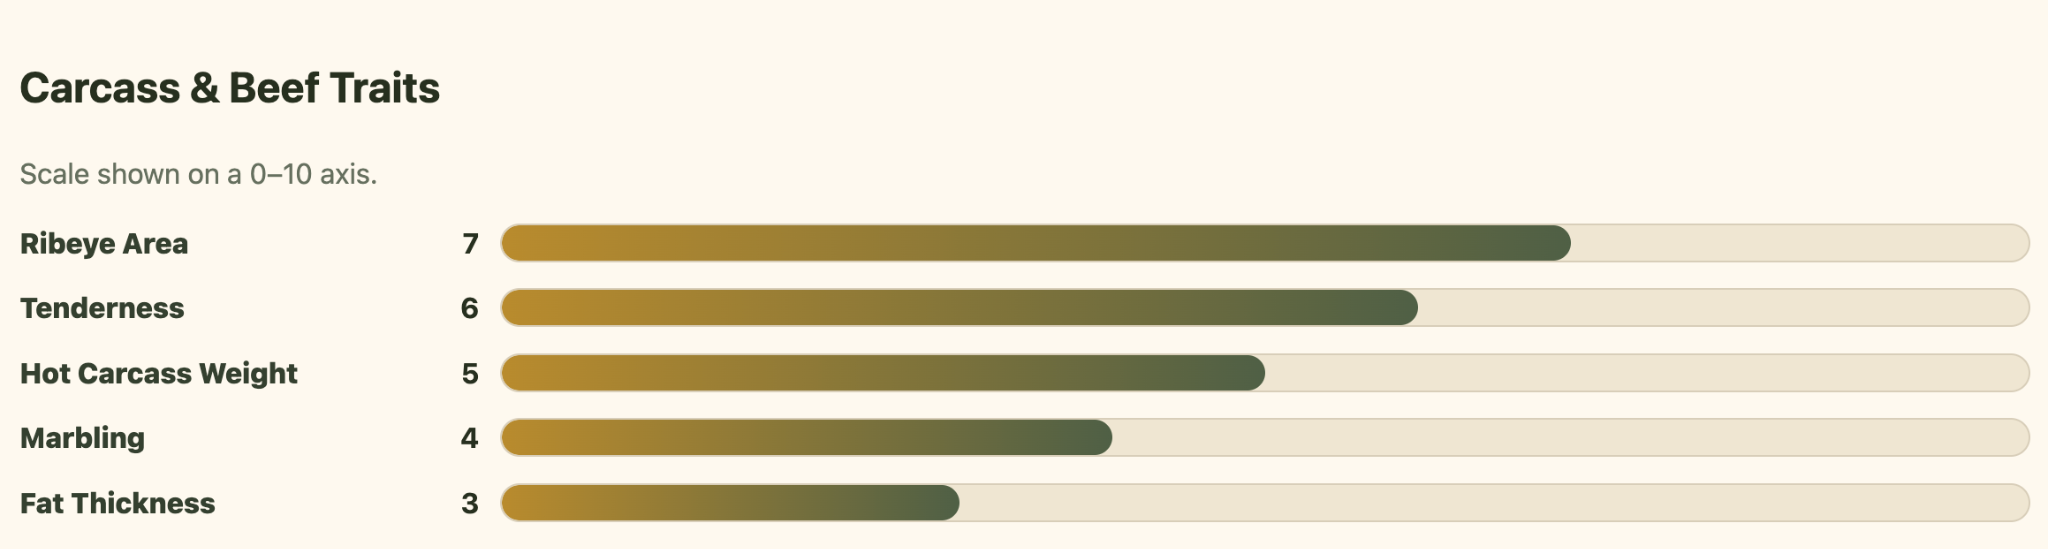
Comparing prediction with progeny
The original Igenity scores of Anna and Maverick allow a simple parental midpoint to be calculated for the directly comparable traits. The midpoint is not an exact genetic forecast, but it provides a practical reference point.
| Trait | Anna | Predicted midpoint | DunSmoke observed | Maverick |
|---|---|---|---|---|
| Marbling | 4 | 3.5 | 4 | 3 |
| Ribeye Area | 6 | 6.5 | 7 | 7 |
| Average Daily Gain | 2 | 2.5 | 2 | 3 |
| Fat Thickness | 3 | 2.5 | 3 | 2 |
| Tenderness | 4 | 4.0 | 6 | 4 |
| Hot Carcass Weight | 4 | 4.5 | 5 | 5 |
Igenity reports whole-number scores, while parental midpoints can fall between two numbers. Lower fat thickness is treated favorably in the Breeding Analytics index.
Marbling
Anna scored 4 and Maverick scored 3, producing a midpoint of 3.5. DunSmoke received a score of 4, placing him on the favorable side of the midpoint and matching Anna.
Ribeye area
Anna scored 6 and Maverick scored 7. Their midpoint was 6.5, while DunSmoke scored 7. He reached the favorable adjacent whole number and matched Maverick’s stronger result.
Average daily gain
The parental scores of 2 and 3 produced a midpoint of 2.5. DunSmoke received a score of 2. This trait did not reach the midpoint expectation and is a useful reminder that a calf will not equal or exceed the parental midpoint in every category.
Fat thickness
Anna scored 3 and Maverick scored 2, producing a midpoint of 2.5. DunSmoke received a score of 3. Because lower fat thickness is favored in the index, this result was slightly less favorable than the midpoint and matched Anna rather than Maverick.
Tenderness
Both parents scored 4, so the predicted value was 4. DunSmoke received a tenderness score of 6, the most notable positive difference in the comparison.
Hot carcass weight
Anna scored 4 and Maverick scored 5, producing a midpoint of 4.5. DunSmoke received a score of 5, again reaching the favorable adjacent whole number. This trait was not part of the four-trait search shown in the prediction screenshot, but it provides additional context for his carcass profile.
What did the prediction get right?
The analytics result correctly identified the mating as one with the potential to produce a useful combination of carcass traits. DunSmoke reached or exceeded the parental midpoint in marbling, ribeye area, tenderness, and hot carcass weight. Fat thickness remained close to expectation, while average daily gain fell below the midpoint.
The outcome was not an exact duplication of the prediction, but it was reasonably consistent with the direction suggested by the parental data: favorable ribeye area, acceptable marbling and fat thickness, and a balanced carcass profile. Tenderness was better than predicted.
What this example does not prove
One calf cannot validate a breeding model. Full siblings can inherit different combinations of genes from the same parents, and this comparison uses genomic indicators on both sides rather than ultrasound, growth, or harvested carcass measurements.
The 104.7 predicted index should also not be compared directly with DunSmoke’s individual 1–10 scores. The index is a normalized summary of the selected traits, while the Igenity profile reports each trait separately.
Why the comparison still matters
The value of Breeding Analytics is not that it eliminates uncertainty, but that it gives breeders a more organized way to evaluate possible matings before the calf exists. It helps answer practical questions about complementarity, tradeoffs, and overall balance for the breeder’s objective.
In the Anna-and-Maverick mating, DunSmoke did not exceed every expectation. He did develop the favorable ribeye area anticipated from his parents, maintained their general marbling and fat profile, matched the favorable hot carcass weight expectation, and substantially outperformed the tenderness prediction.
Prediction supports judgment
Breeding Analytics is intended to support experienced cattle evaluation, not replace it. Pedigree, genetic relationships, structure, feet and legs, disposition, fertility, maternal performance, calving practicality, breed character, and environmental suitability still matter.
As more sires, dams, and offspring are tested, comparisons like this will become more useful and should help show where predictions are dependable and where variation remains greatest.
Explore the underlying records: The public database includes available animal profiles, Igenity results, pedigrees, and the Breeding Analytics tool used in this case study.
Case study published July 28, 2026. Igenity is a genomic prediction tool. Results should be considered with phenotype, pedigree, management, and breeder judgment.